Overview
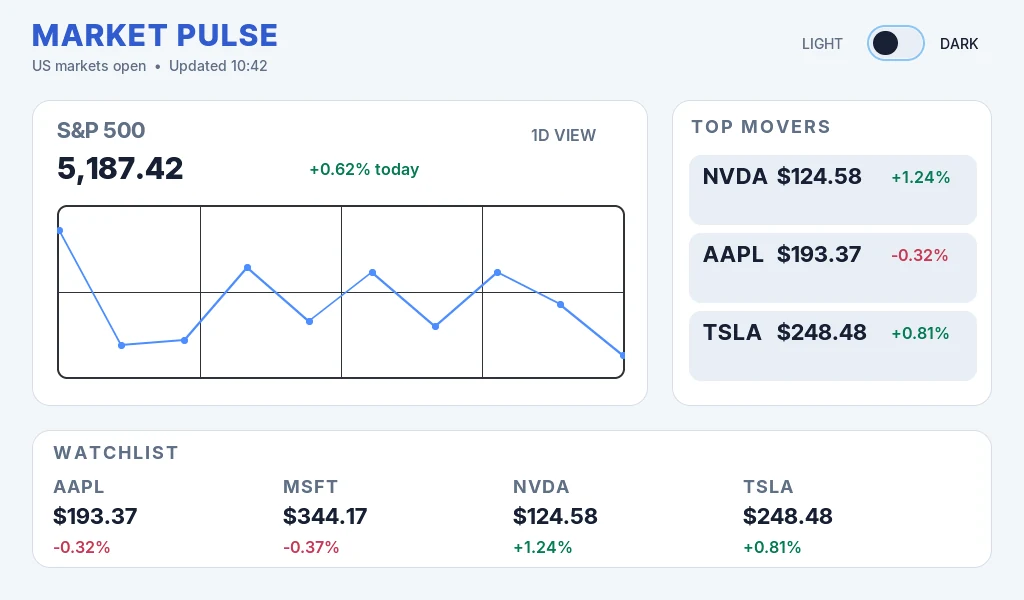
Market Pulse is a free LVGL stock market dashboard template for a 1024 x 600 landscape display. It presents a broad-market index, daily movement, a compact intraday chart, top movers, market status, and a four-symbol watchlist on one screen.
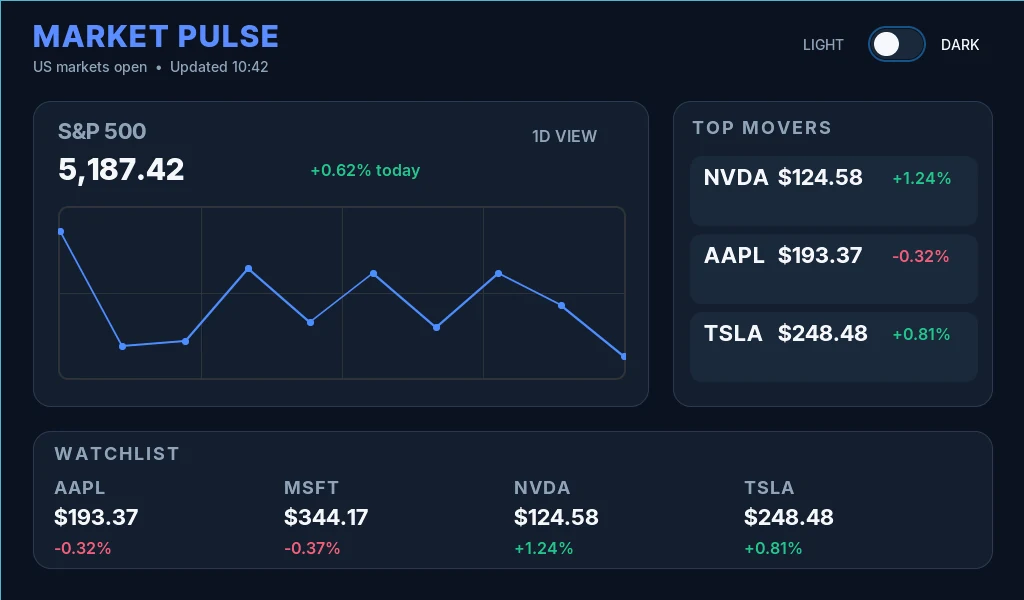
The project includes complete light and dark color systems rather than relying on two flattened screenshots. Its on-screen switch is configured to cycle between the Market_Pulse_Light and Market_Pulse_Dark themes, so the same dashboard structure can change appearance without duplicating the screen.
This is a visual UI template, not a trading system or financial-data service. The prices, percentages, chart points, market state, and update time shown in the preview are sample content. The project does not provide live quotes, order entry, portfolio calculations, alerts, or financial advice.
What's included
- One 1024 x 600 LVGL screen named
Market Pulse — Native Theme. - Market header with session status, update time, and theme labels.
- S&P 500 overview card with index value, daily change, period label, and an editable LVGL chart.
- Top movers card with sample NVDA, AAPL, and TSLA rows.
- Watchlist strip with sample AAPL, MSFT, NVDA, and TSLA values.
- Interactive theme switch that cycles between the included light and dark themes.
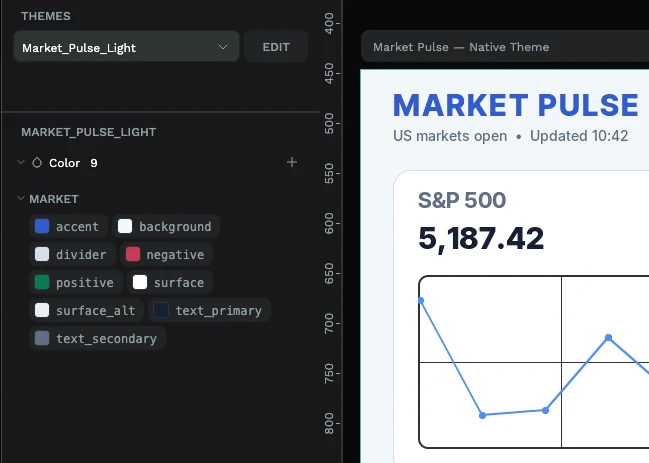
- Two nine-color token sets shared by the screen objects.
- Five local font assets sized for utility text, data, headings, strong values, and the main index display.
The template uses native interface objects throughout. It contains no imported images, animated images, or icons, which makes it easy to restyle and avoids adding bitmap assets to the generated project.
Dashboard layout
The header establishes identity and freshness first. MARKET PULSE is the largest label, with US markets open and Updated 10:42 directly beneath it. The theme control sits on the opposite side, keeping appearance settings available without competing with the financial content.
The main row is split into two cards. The larger market overview gives the S&P 500 value and daily direction most of the width, then uses a 568 x 174 chart for the intraday trend. The narrower top-movers card turns three symbols into quick comparison rows with positive values in green and negative values in red.
The watchlist spans the lower portion of the screen. Each symbol gets the same hierarchy—ticker, price, and percentage change—so a firmware integration can update the four columns consistently. This wide strip also leaves enough horizontal room for longer values without converting the interface into a dense table.
Light and dark themes
Both themes define the same nine semantic tokens:
accentbackgrounddividernegativepositivesurfacesurface_alttext_primarytext_secondary
The light theme combines a pale blue-gray background, white cards, deep navy text, blue accents, green gains, and red losses. The dark theme changes the background and surfaces to layered navy tones while preserving the same semantic roles. Because the objects refer to token names instead of isolated color values, edits to a theme can flow through the entire dashboard.
The theme switch has a configured LVGL clicked event with a set-theme action in cycle mode. It switches between both supplied themes; no second screen is required.
Asset and font snapshot
The PicoPixel local library contains:
- Images:
0 - Animated images:
0 - Icons:
0 - Colors:
0in the local asset group; colors are organized as design tokens instead - Fonts:
5 - Components:
0
The five font assets are:
Market Utility 14 500 14Market Data 16 600 16Market Heading 18 700 18Market Strong 22 700 22Market Display 30 800 30
Each is converted at 4 bits per pixel with a compact character range covering printable ASCII plus the bullet used in the market-status line. That keeps typography roles predictable while avoiding a single oversized font resource for every label.
Editable LVGL structure
The screen is assembled from eight frames and 33 rectangle-based objects. The named Market Overview Card, Top Movers Card, and Watchlist Strip frames provide the main structure. Individual labels such as Index Value, NVDA Price, AAPL Delta, and MSFT Watch Symbol remain separate update targets.
The S&P 500 Intraday Chart is configured as an LVGL chart object rather than a pre-rendered graph image. That gives an application a clean place to replace the example points with normalized data while retaining the card layout and theme styling. The Theme Toggle is an LVGL switch and is the only configured interaction in the supplied project.
Why this works well for LVGL
- Native labels keep market values editable without regenerating graphics.
- A native chart avoids a full-screen bitmap and can receive new points at runtime.
- Semantic theme tokens keep light and dark styling synchronized.
- Consistent mover and watchlist rows support simple repeated update logic.
- The fixed 1024 x 600 canvas fits wide embedded dashboards with enough room for a readable chart.
- Text accompanies every gain or loss color, so direction is not communicated by color alone.
The generated UI can sit on top of an application built with ESP-IDF, Arduino, PlatformIO, STM32, Zephyr, or another LVGL workflow. Those environments are possible integration paths, not hardware that has been verified with this template.
Connecting live market data
A production implementation needs a licensed and appropriate market-data source, a network and caching layer, symbol mapping, trading-session logic, and explicit handling for delayed or stale quotes. Fetching, authentication, JSON parsing, retries, and rate limiting should live outside the generated screen code.
Pass a normalized snapshot into the presentation layer, then update the visible labels and chart on the LVGL thread. Include a clear data timestamp and distinguish real-time, delayed, closed-market, loading, disconnected, and unavailable states. Do not imply that a quote is current simply because the device still has an older value in memory.
For the chart, decide whether the visible series represents price, percentage change, or a normalized index before mapping incoming points. Keep the selected range—such as 1D VIEW—consistent with both the data interval and market time zone.
Customizing the template
- Replace the sample index and ticker symbols with the instruments your application supports.
- Change
US markets openinto a data-backed market state and localize the update time. - Add delayed-data, stale-data, offline, and loading treatments.
- Rebind the chart to a fixed-length LVGL series and document its time interval.
- Adjust the positive and negative palettes while preserving text labels or signs.
- Add another token theme for high contrast, brand colors, or a nighttime enclosure.
- Turn the watchlist into a portfolio summary, crypto market panel, commodity tracker, or business KPI strip.
- Rename generated objects to match the identifiers used by your firmware presentation layer.
Exporting to your project
Open the template in PicoPixel, customize the symbols and theme tokens, and confirm that 1024 x 600 matches your target panel. Then export the design as LVGL C and connect the named labels, chart, and theme control to your application state.
A practical workflow is:
- Open the template in PicoPixel or download the
.picopixelproject. - Define the source, update interval, time zone, and freshness rules for your data.
- Rename the important index, mover, watchlist, chart, and status objects.
- Add loading, delayed, stale, disconnected, and error states.
- Export the UI and integrate it with your LVGL application.
- Update labels and chart points through a dedicated presentation layer.
- Verify long prices, negative values, market-state labels, and both themes on the physical display.
See How to use PicoPixel templates for the import workflow. For a wider embedded integration walkthrough, read the ESP32 LVGL UI tutorial.
Best uses
This template is a strong starting point for:
- Embedded stock and index dashboards
- Desk market displays
- ESP32 and STM32 financial panels
- Light and dark LVGL theme examples
- Native LVGL chart prototypes
- Portfolio summary interfaces
- Crypto or commodity market adaptations
- Business KPI and operations dashboards
- Wide 1024 x 600 display projects
Its most reusable feature is the combination of a native chart, clearly named data labels, and token-driven theme switching in one editable screen.