Overview
The Shenzhen Weather Dashboard is a free LVGL weather UI template for a 480 x 480 square display. It combines current conditions, apparent temperature, daily high and low values, humidity, wind, precipitation, and a four-day outlook in a compact layout designed for quick reading.
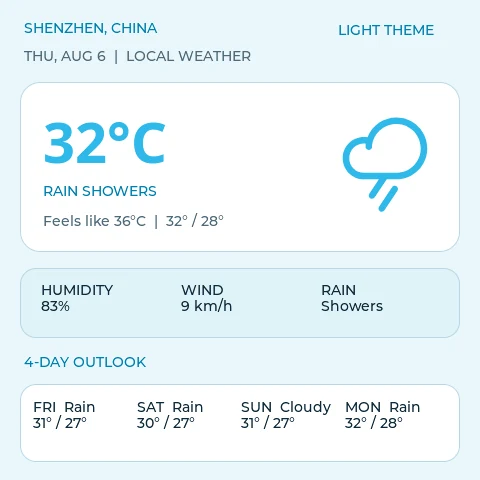
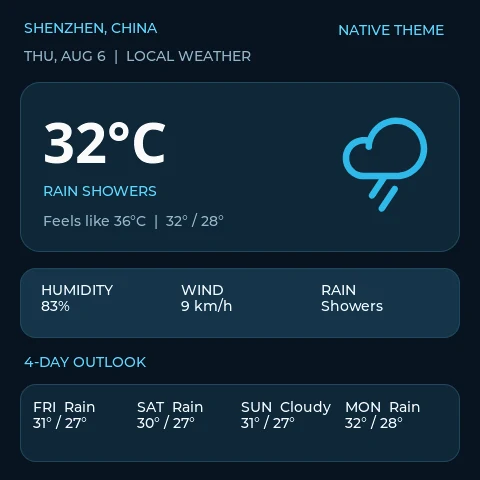
The project includes two editable screen variants. The bright version uses an airy blue-white palette, while the dark version uses layered navy surfaces with the same cyan weather accent. Both preserve the same information hierarchy, making them useful as visual alternatives for daylight and nighttime displays.
The preview values are static design content, not a live Shenzhen forecast. The template does not include a weather API, location service, network requests, automatic refresh, severe-weather alerts, configured events, or animations. Connect and validate those behaviors in your application after export, and do not use the sample screen as the sole source for safety-critical weather decisions.
What's included
- Two editable 480 x 480 LVGL screens, covering bright and dark visual treatments.
- Location and date header, showing Shenzhen, China and local-weather context.
- Current-condition card, with
32°C, rain-showers status, apparent temperature, daily high and low, and a large rain icon. - Weather metrics card, displaying humidity, wind speed, and precipitation condition.
- Four-day outlook, with Friday through Monday sample conditions and temperatures.
- One imported rain icon, sized at 104 x 104 pixels.
- One converted 56 px font asset for the large temperature reading.
The published project contains no configured interactions. The two variants are separate screens, so automatic light/dark switching or navigation between them must be added separately if the final product requires it.
Weather dashboard layout
The top row identifies the location before presenting any measurements. SHENZHEN, CHINA sits opposite the theme label, while the date and LOCAL WEATHER caption provide context directly underneath. This keeps the dashboard useful when it is displayed independently rather than inside a larger weather app.
The current-condition card is the primary focus. A large 32°C value occupies the left side, supported by RAIN SHOWERS and a feels-like line. The rain icon balances the card on the right and provides an immediate visual cue without replacing the written condition.
Humidity, wind, and rain are grouped into a shallower secondary card. All three metrics use the same two-line pattern, which makes the section easy to scan and straightforward to update from a normalized weather snapshot.
The four-day outlook is separated by its own heading and lower card. Each day receives a consistent column with weekday, condition, high, and low. The forecast stays intentionally concise so the current temperature remains the screen’s strongest element.
Bright and dark variants
The bright screen uses a pale blue background, white condition and forecast cards, a slightly deeper blue metrics surface, dark slate body text, and cyan highlights. It is the version used for this template’s card thumbnail.
The dark screen replaces the background with near-black navy and uses two blue-gray surface levels for its cards. White emphasizes the temperature, while cyan continues to mark the location, condition, outlook heading, and weather icon. Muted blue-gray text keeps the date and feels-like information visible without competing with the main reading.
Because both screens share the same layout and object names, firmware can target equivalent labels in either variant. If the final application only needs one appearance, remove the unused screen before export. If it needs runtime theme switching, consolidate the palette into semantic color roles or add explicit screen/theme events in PicoPixel.
Asset snapshot
The PicoPixel local library contains:
- Images:
0 - Animated images:
0 - Icons:
1 - Colors:
0, with the shown colors applied directly to the objects - Fonts:
1 - Components:
0
The Shenzhen Rain icon is a 104 x 104 local PNG asset used on both screens. Its simple cyan outline remains readable against the white card and the dark navy surface.
The single font asset, Shenzhen Weather Temperature 700 56, is a bold 56 px conversion for the large temperature value. It uses 4 bits per pixel and includes printable Latin characters, Latin-1, Latin Extended-A, and the degree symbol. Supporting labels use the project’s standard text styling rather than additional converted sizes.
Editable LVGL structure
The project contains nine frames and 30 rectangle-based objects. Shenzhen Weather — Native Theme and Shenzhen Weather — Light are the two screen frames. Each screen contains matching Current Conditions, Weather Metrics, and Forecast containers.
Important values remain separate labels, including Temperature, Condition, Feels Like, Humidity, Wind, Rain, and the individual weekday forecasts. The Rain Icon is a separate LVGL image object on each screen. These meaningful names make it easier to replace the sample text without rebuilding the visual layout.
There are no configured events or animations in the supplied file. Updating values, selecting a screen, refreshing the forecast, or reacting to touch input requires application code or additional PicoPixel event wiring.
Why this works well for LVGL
- Labels keep every weather value editable from firmware.
- Containers separate current conditions, metrics, and forecast data into predictable groups.
- One reusable icon supplies a strong weather cue with modest asset overhead.
- Matching screen structures simplify bright and dark adaptations.
- The fixed square canvas fits common 480 x 480 embedded panels.
- Written conditions accompany the icon and color treatment, preserving meaning when the symbol or palette is less visible.
The visual layer can be integrated with ESP-IDF, Arduino, PlatformIO, STM32, Zephyr, ESPHome, or another LVGL environment. These are possible workflows rather than verified hardware targets for the supplied project.
Connecting live weather data
A live implementation needs a weather provider, location handling, network and caching logic, unit conversion, time-zone rules, and clear unavailable or stale states. Fetch and normalize the provider response outside the generated UI code, then send a small presentation-ready snapshot to the LVGL screen.
Update the location, observation time, current temperature, apparent temperature, high and low, humidity, wind, condition, and forecast rows together so the screen does not mix values from different refresh cycles. Preserve a visible last-updated time, and make stale data explicit when a refresh fails.
Weather condition codes vary by provider. Map them to a controlled set of labels and icons such as clear, partly cloudy, cloudy, rain, thunderstorm, fog, and unavailable. Do not build interface behavior around the provider’s human-readable description alone.
Customizing the template
- Replace Shenzhen with the device location or a user-selected city.
- Localize dates, weekday names, conditions, units, and decimal formatting.
- Switch between Celsius and Fahrenheit while checking the available label width.
- Replace the rain icon with a small condition-icon set.
- Add observation time, air quality, precipitation probability, or sunrise and sunset only when the screen remains easy to scan.
- Define loading, stale, offline, and unavailable states.
- Convert the two palettes into semantic theme tokens if runtime theme switching is required.
- Use a light sensor or schedule to select the appropriate visual mode.
- Rename the important objects before export to match the firmware presentation layer.
Exporting to your project
Open the template in PicoPixel, select or customize the desired visual variant, and confirm that 480 x 480 matches the target panel. Then export the UI, rain icon, and font as LVGL C and connect the labels to your application’s verified weather snapshot.
A practical workflow is:
- Open the template in PicoPixel or download the
.picopixelproject. - Choose the bright screen, dark screen, or a consolidated themed version.
- Define the weather provider, units, refresh schedule, and time-zone behavior.
- Add loading, stale, offline, and unavailable states.
- Rename the condition, metric, and forecast objects for your codebase.
- Export the UI and integrate it with the LVGL application.
- Update all visible values from one normalized weather snapshot.
- Verify long locations, translated conditions, units, and both palettes on the physical display.
See How to use PicoPixel templates for the import workflow. For a broader embedded display walkthrough, read the ESP32 LVGL UI tutorial.
Best uses
This template is a useful starting point for:
- Square desktop weather displays
- ESP32 and STM32 weather stations
- Smart-home status panels
- ESPHome weather dashboards
- Local forecast kiosks
- Bright and dark UI comparisons
- LVGL image and font examples
- 480 x 480 embedded display projects
- Air-quality or environmental monitor adaptations
Its strongest feature is the simple scan order: location, current condition, supporting measurements, and the short forecast are all visible without turning the square screen into a dense grid.