Overview
The ESPHome AC Control project is a free LVGL thermostat and climate-control template with two alternative 480 x 480 screen designs. It gives you a polished visual starting point for an ESPHome display, ESP32 thermostat, air-conditioner controller, heat-pump panel, or smart-home climate interface.
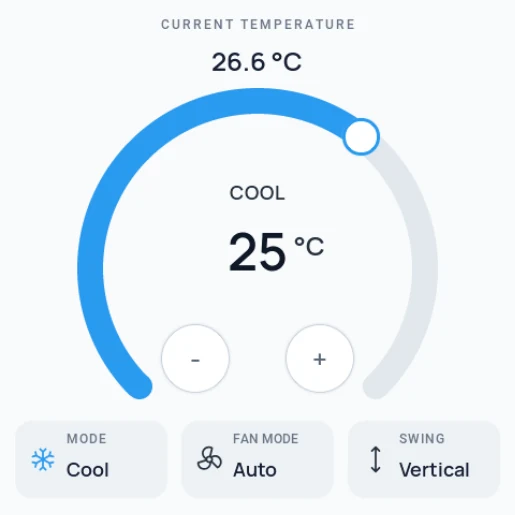
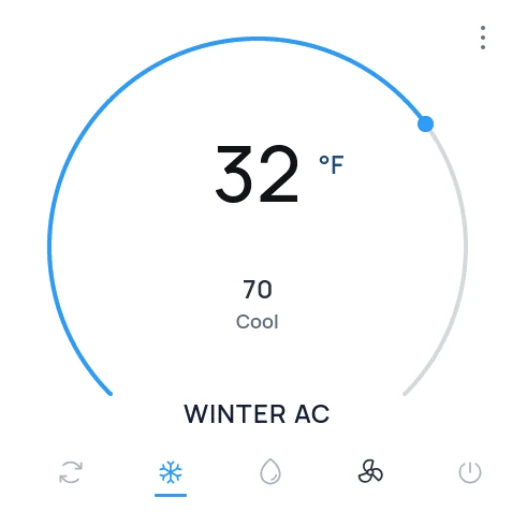
The first screen is a card-based Smart Home Thermostat. It combines the current room temperature, a large cooling setpoint, plus and minus buttons, and compact mode, fan, and swing cards. The second screen is a more minimal Winter AC Control design with a large circular dial, oversized temperature value, cooling state, device name, and a row of mode icons.
Both screens use a light background, blue cooling accents, dark typography, and large touch-friendly targets. They are editable UI designs rather than complete ESPHome configurations: the supplied project does not include YAML, Home Assistant entities, networking, sensor bindings, climate calls, configured events, or animations.
What's included
- Two 480 x 480 LVGL screens, offering different thermostat layouts for the same square display format.
- Current-temperature readout, shown as
26.6 °Con the Smart Home Thermostat screen. - Large cooling setpoint, shown as
25 °Cinside a circular thermostat arc. - Increase and decrease buttons, positioned beneath the setpoint for direct temperature adjustment.
- Mode card, showing a snowflake icon and
Coolstate. - Fan card, showing
Autofan mode. - Swing card, showing a
Verticallouver state. - Alternative circular AC dial, shown with a large
32 °Fvalue and a smaller70target value. - Bottom control row, covering cycle, cool, dry, fan, and power concepts.
- Seven icon assets shared across the thermostat and AC control designs.
- Five converted font assets supporting labels, values, units, and the oversized temperature display.
The two screens are separate designs in the same project. There is no built-in navigation between them, so you can use one as the main interface, keep both as variants, or adapt them into separate climate-device screens.
Smart Home Thermostat screen
The Smart Home Thermostat places the current room reading at the top, then gives most of the canvas to the target-temperature control. The blue arc is the visual focal point, with COOL and 25 °C centered inside it. A circular handle near the upper-right edge suggests direct dial interaction, while the minus and plus buttons provide a simpler discrete adjustment pattern.
Three cards along the bottom keep secondary settings visible:
- Mode:
Cool - Fan mode:
Auto - Swing:
Vertical
Each card uses a small icon, an uppercase category label, and a larger state value. This creates a clear hierarchy even when the climate configuration grows beyond a single setpoint.
The light-gray background and slightly darker cards help the blue arc stand out without relying on strong shadows or decorative artwork. For a physical display, the large central value and 64 x 64 adjustment buttons are useful starting points, but their real touch size should still be evaluated against the panel dimensions, bezel, viewing distance, and input device.
Winter AC Control screen
The second design uses a simpler circular composition. A thin blue arc follows most of the screen perimeter, with a handle marking the current position. The large 32 °F reading is centered in the upper half, while 70, Cool, and WINTER AC create a smaller vertical information stack below it.
A bottom navigation row provides five control concepts:
- Cycle or automatic mode
- Cooling
- Dry or dehumidification
- Fan
- Power
The snowflake is highlighted in blue with a short underline, demonstrating a selected mode without changing the entire screen. The three-dot menu in the top-right suggests a place for schedules, calibration, network settings, or advanced climate options.
This variant is useful when you want the display to feel more like a dedicated appliance control than a smart-home dashboard. It is also easier to simplify further because the screen has fewer supporting cards.
Asset snapshot
The PicoPixel local library contains:
- Images:
0. - Animated images:
0. - Icons:
7. - Colors:
0, with the palette applied directly to screen objects. - Fonts:
5. - Components:
0.
The icon assets are:
Thermostat Snowflake— 28 x 28Thermostat Fan— 28 x 28Thermostat Swing Vertical— 28 x 28Whynter Cycle— 28 x 28Whynter Dry— 28 x 28Whynter Power— 28 x 28Speedometer Icon— 48 x 48
The five converted fonts include Manrope and Roboto styles:
Speedometer Roboto Medium 500 12Smart Home Manrope Semibold 600 18Smart Home Manrope Semibold 600 24Smart Home Manrope Semibold 600 48Whynter Manrope Medium 500 72
The thermostat-specific Manrope conversions include the degree symbol needed by the Celsius and Fahrenheit values. The large 72-pixel font supports the oversized temperature treatment on the minimal AC screen.
Editable LVGL structure
The project uses normal LVGL-friendly objects rather than flattened screen images. Both 480 x 480 designs are screen frames. The two large temperature rings are arc objects, the text values are labels, cards are containers, and the mode symbols are small image assets.
The Smart Home Thermostat includes named objects such as Thermostat Arc, Current Temperature Value, Target Temperature, Decrease Temperature, Increase Temperature, Cooling Mode Card, Fan Mode Card, and Swing Mode Card. The alternative screen includes AC Temperature Dial, Room Temperature, AC Setpoint, AC Mode, and the bottom control icons.
That structure lets you update the room reading, target setpoint, climate state, fan mode, swing mode, and selected icon separately. The supplied project does not contain event wiring, so the buttons and mode icons are visual controls until you connect them to exported LVGL callbacks or ESPHome actions.
Why this works well for LVGL and ESPHome
The interface maps naturally to an ESPHome display application built with LVGL:
- Labels can display climate entity values, target temperatures, modes, and sensor readings.
- Arc objects provide an editable thermostat dial, without requiring a large transparent image.
- Buttons offer clear adjustment targets for touch input or can be adapted for encoder control.
- Cards group secondary climate settings, keeping mode, fan, and swing states easy to scan.
- Small image assets provide familiar control symbols while preserving editable layout and text.
- Two screen variants provide a choice of hierarchy, from information-rich thermostat to appliance-style dial.
ESPHome can supply the data and actions, but the exact YAML depends on your climate platform, display component, LVGL configuration, temperature units, and available services. Treat the exported UI as the presentation layer and map it only to entities and actions supported by your actual device.
Connecting climate data
A typical integration needs to update at least the current temperature, target temperature, HVAC mode, fan mode, and swing state. The plus and minus controls can then call a handler that changes the requested setpoint through your application or ESPHome climate entity.
A small LVGL-side presentation function could look like this:
static void thermostat_set_values(float current_c,
                                  float target_c,
                                  const char * mode)
{
    lv_label_set_text_fmt(ui_current_temperature_value, "%.1f °C", current_c);
    lv_label_set_text_fmt(ui_target_temperature, "%.0f", target_c);
    lv_label_set_text(ui_climate_mode, mode);
}
This example only updates UI objects. It does not implement an ESPHome climate component, validate setpoint limits, handle unit conversion, or command HVAC equipment. Keep actual climate control, compressor protection, equipment timing, and sensor validation in the appropriate device and automation layers.
When wiring the buttons, make sure a requested change is visibly acknowledged and eventually reconciled with the value reported by the climate entity. If the device is offline or rejects a setpoint, the display should not continue showing the request as though it were confirmed.
Customizing the template
- Choose the Smart Home Thermostat or Winter AC screen as your primary design, or keep both for different devices.
- Replace the sample device name and temperatures with values from your ESPHome climate and sensor entities.
- Switch between Celsius and Fahrenheit consistently across the main value, target value, ranges, and formatting.
- Adjust the arc range to the permitted heating and cooling setpoints.
- Add heat, auto, fan-only, dry, and off states only when the connected climate platform supports them.
- Change the selected-mode indicator and icon colors when the active HVAC mode changes.
- Add unavailable and disconnected states for missing sensors or network loss.
- Rename objects before export so LVGL references match your ESPHome or firmware conventions.
- Convert the bottom settings cards into buttons if mode, fan, and swing should be interactive.
- Add a schedule, humidity, outdoor-temperature, or energy-use screen without crowding the primary control.
Exporting to your project
Open the template in PicoPixel, select the screen style you want, and replace the sample values and labels. Confirm the 480 x 480 resolution, orientation, color depth, and input method of the target hardware before exporting the project as LVGL C.
A practical workflow is:
- Open the template in PicoPixel or download the
.picopixelproject. - Choose the card-based thermostat or minimal AC dial as the main screen.
- Define the supported HVAC modes, setpoint bounds, fan modes, and swing modes.
- Rename the important labels, arc, buttons, and icons.
- Add unavailable, offline, pending, and error states.
- Export the UI, icons, and fonts as LVGL C.
- Integrate the generated files with your ESPHome, ESP-IDF, Arduino, PlatformIO, or other LVGL application.
- Map display updates and input callbacks to the real climate entity.
- Verify touch targets, temperature units, state synchronization, and failure behavior on the physical display.
For help opening the project, see How to use PicoPixel templates. For a broader display integration walkthrough, read the ESP32 LVGL UI tutorial.
Best uses
This template is a useful starting point for:
- ESPHome climate-control displays
- ESP32 smart thermostats
- Air-conditioner remote panels
- Heat-pump and mini-split UI concepts
- Home Assistant companion displays
- Square 480 x 480 touch interfaces
- LVGL thermostat arc examples
- Fan and swing mode controls
- Appliance-style temperature dials
- Smart-home climate dashboard prototypes
The two included screen styles make it especially useful when deciding whether a product needs a detailed thermostat dashboard or a simpler appliance-focused control.