Overview
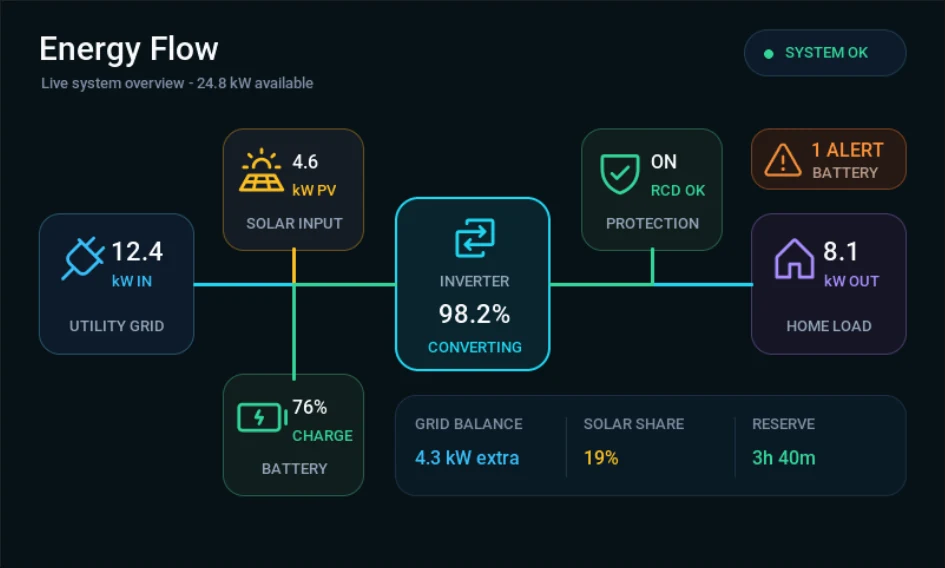
The Energy Flow Dashboard is a free LVGL template for visualizing how power moves between the utility grid, solar input, battery storage, inverter, protection system, and home load. Its 800 x 480 landscape layout is suited to a wide embedded panel used for a solar inverter display, home energy monitor, battery system interface, or smart electrical dashboard prototype.
The main flow line creates a clear left-to-right path from the utility grid through the inverter and toward the home load. Solar and battery cards connect vertically into that path, while the protection card branches above it. A status badge, alert panel, and compact summary strip provide supporting system information without obscuring the core energy flow.
Every value in the preview is sample content. The supplied project is a visual interface template and does not include power measurement, inverter communication, relay control, electrical protection logic, alarms, events, or animations.
This template is not a certified meter, protection device, battery-management system, inverter controller, or electrical safety system. Real installations require qualified electrical engineering, correct isolation and sensing hardware, fail-safe protection, verified firmware, and compliance with applicable electrical and product-safety requirements.
What's included
- One 800 x 480 LVGL screen, designed for a wide rectangular display.
- Utility grid card, showing
12.4 kW INin the sample state. - Solar input card, showing
4.6 kW PVand connecting into the main flow. - Battery card, displaying a
76%charge state beneath the solar branch. - Central inverter card, with
98.2%efficiency and aCONVERTINGstate. - Protection card, showing an enabled state and
RCD OKstatus. - Home load card, displaying
8.1 kW OUTat the end of the flow path. - System status badge, using a green dot and
SYSTEM OKlabel. - Battery alert panel, demonstrating an orange
1 ALERTstate. - Energy summary strip, showing grid balance, solar share, and reserve time.
- Seven imported icon assets for the major energy and status concepts.
- Four converted Roboto font assets for titles, measurements, units, and labels.
The project keeps all information on one screen. There is no navigation or interaction wiring to remove before adapting it to a real monitoring application.
Energy flow layout
The dashboard treats the inverter as the center of the system. A cyan horizontal line runs from the grid card on the left, through the inverter, and toward the home load on the right. This makes the conversion path understandable before the user reads any numbers.
Solar input and battery storage sit on a shared green branch. Solar appears above the main line and battery below it, creating a compact relationship between generation, storage, and conversion. The protection card uses another green branch above the output side, keeping the electrical safety state visually connected to the outgoing path.
Each system card uses the same basic hierarchy:
- A recognizable icon establishes the source or destination.
- A large value communicates power, charge, efficiency, or state.
- A colored unit or status clarifies the meaning.
- A muted uppercase label names the system component.
Color differentiates the domains without overwhelming the screen. Cyan is used for grid and inverter values, amber for solar generation, green for battery and protection, violet for home consumption, and orange for the alert state. The dark background and consistent card geometry keep those accents readable as one system.
Status and summary information
The upper-right SYSTEM OK badge provides an overall state separate from the detailed protection and alert cards. This is useful when the operator needs a quick answer first and can inspect individual subsystems second.
The orange alert card is deliberately more prominent than the normal-state cards. It combines a warning icon, a count, and the affected area—BATTERY in the sample—so the condition is not communicated by color alone. A production interface should also define warning priority, acknowledgement behavior, fault details, and the difference between active, latched, cleared, and historical alarms.
The lower summary strip gathers three derived values:
- Grid balance:
4.3 kW extra - Solar share:
19% - Reserve:
3h 40m
These are examples rather than implemented calculations. If you connect live data, define the direction and sign convention for grid balance, how solar share is calculated, and what load assumptions are used for reserve time.
Asset snapshot
The local library contains a focused set of assets:
- Images:
0. - Animated images:
0. - Icons:
7. - Colors:
0, with colors applied directly to the objects. - Fonts:
4. - Components:
0.
All seven icon assets are 44 x 44 PNGs:
Grid Plug CyanSolar Panel AmberBattery Charging GreenInverter Swap CyanProtection Shield GreenHome Load VioletWarning Orange
The four font assets use Roboto Medium at 13, 16, 22, and 28 pixels. They cover small captions, normal card labels, status values, and the larger dashboard measurements. Their converted character ranges include standard ASCII, Latin-1 Supplement, and Latin Extended-A, making the bundled set more flexible for European-language labels than an ASCII-only conversion.
Editable LVGL structure
The single screen is organized around the main system cards and the flow lines between them. Important objects use descriptive names such as Grid Card, Solar Card, Battery Card, Inverter Card, Protection Card, Home Load Card, Alert Card, and Energy Summary Strip.
The energy paths are separate line objects rather than part of a background image. Values and captions are label objects, system blocks are containers, and the seven symbols are small images. This structure means you can update data, change a state, hide a subsystem, or restyle a path without replacing the full dashboard artwork.
The supplied project has no configured events or animations. If the final product needs animated flow direction, warning acknowledgement, detail screens, or touch navigation, those behaviors must be designed and connected separately.
Why this works well for LVGL
The dashboard is composed from a small group of familiar LVGL object types:
- Containers provide consistent cards for each energy source, destination, and status.
- Labels hold all measurements and units, allowing straightforward runtime updates.
- Line objects preserve editable energy paths without using a large diagram image.
- Small icon assets identify subsystems while keeping the rest of the interface vector-like and configurable.
- A fixed 800 x 480 canvas gives a predictable target for common landscape embedded panels.
- Text reinforces every color-coded state, improving clarity when colors are difficult to distinguish.
For real data, the UI should receive validated display values from a dedicated presentation layer. Sensor acquisition, Modbus or CAN communication, inverter commands, protection decisions, and relay control should remain outside generated screen code.
Connecting live energy data
After exporting the project, application code can update the visible labels from a normalized energy snapshot. A simple presentation function might look like this:
static void energy_ui_set_values(float grid_kw,
                                 float solar_kw,
                                 int battery_percent,
                                 float home_kw)
{
    lv_label_set_text_fmt(ui_grid_power_value, "%.1f", grid_kw);
    lv_label_set_text_fmt(ui_solar_power_value, "%.1f", solar_kw);
    lv_label_set_text_fmt(ui_battery_charge_value, "%d%%", battery_percent);
    lv_label_set_text_fmt(ui_home_load_value, "%.1f", home_kw);
}
This example only demonstrates label updates. A complete implementation needs explicit units, data timestamps, bounds checking, stale-data detection, disconnected states, sensor faults, and safe behavior when values are missing or contradictory.
If the lines are used to represent direction, do not assume that a colored line alone explains import versus export or charging versus discharging. Add arrows, direction labels, or animated indicators with a clear fallback for displays where animation is disabled.
Customizing the template
- Replace the sample title and available-power subtitle with the exact system name and summary your project needs.
- Rename the utility, solar, battery, and load cards to match the installed equipment.
- Add import/export and charge/discharge direction states to the flow paths.
- Change the units from kilowatts when displaying watts, volts, amps, energy, or power factor.
- Replace the sample reserve calculation with a documented estimate based on usable battery capacity and measured load.
- Add unavailable and stale-data states instead of showing old values as current.
- Turn the alert card into a real status entry only after defining severity, source, acknowledgement, and recovery behavior.
- Remove solar or battery branches for simpler grid-only products.
- Add another load or generator branch if the screen remains readable at the target physical size.
- Convert repeated visual patterns into reusable PicoPixel components for a multi-screen energy product.
Exporting to your project
Open the template in PicoPixel, inspect the named objects, and replace the sample measurements and statuses. Confirm that the 800 x 480 resolution, display orientation, color depth, and font memory fit the target hardware before exporting as LVGL C.
A practical workflow is:
- Open the template in PicoPixel or download the
.picopixelproject. - Define the real energy sources, loads, directions, units, and update rate.
- Rename the UI objects to match your firmware conventions.
- Create explicit loading, disconnected, warning, fault, and stale-data states.
- Export the interface, icons, and fonts as LVGL C.
- Integrate the generated files with your ESP-IDF, Arduino, PlatformIO, STM32, Zephyr, or other LVGL application.
- Connect validated display values through a presentation interface.
- Verify measurement direction, status priority, readability, and failure behavior on the physical panel.
For help opening the project, read How to use PicoPixel templates. For a broader firmware workflow, see the ESP32 LVGL UI tutorial.
Best uses
This template is a useful starting point for:
- Solar inverter display concepts
- Home energy monitoring panels
- Battery storage dashboards
- Smart electrical distribution UIs
- ESP32 and STM32 energy displays
- Grid import and export visualizations
- Microgrid and backup-power prototypes
- LVGL flow-diagram examples
- Energy status and alarm hierarchy studies
- Wide 800 x 480 embedded interfaces
Its strongest feature is the readable system relationship: grid, generation, storage, conversion, protection, and load are presented as one connected flow rather than a collection of unrelated numbers.