Overview
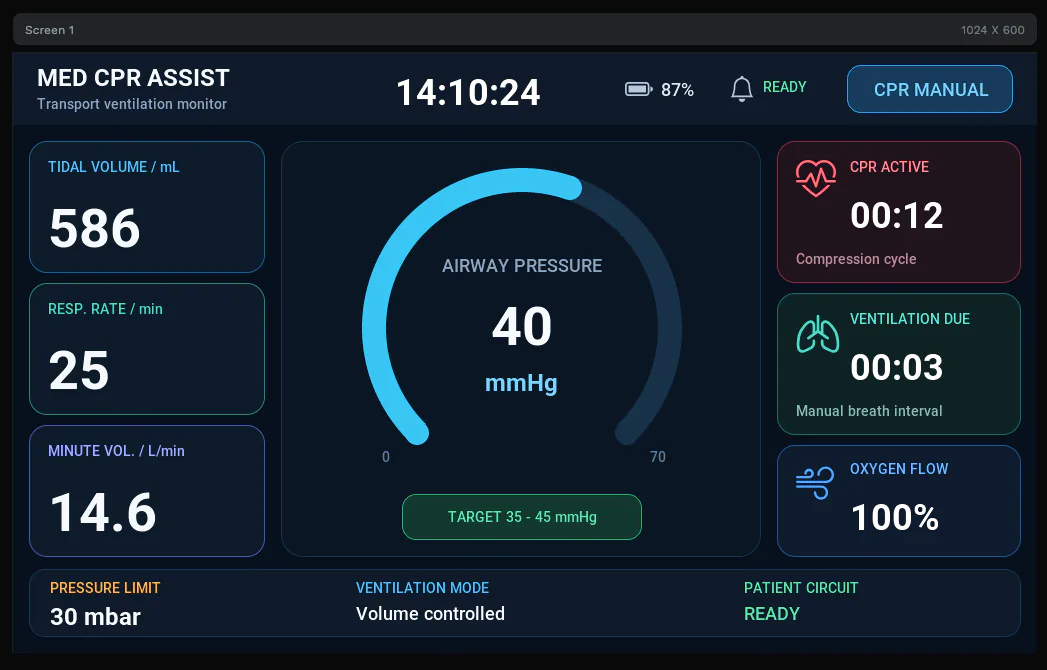
Looking for a free LVGL medical device UI template or a high-contrast embedded dashboard for a wide display? This PicoPixel project provides a complete 1024 x 600 interface concept for a CPR assist and transport ventilation monitor. It organizes airway pressure, ventilation measurements, timed prompts, oxygen status, operating mode, battery state, and patient-circuit readiness into a single screen designed for fast visual scanning.
The layout is intentionally built as editable interface objects instead of one flattened dashboard image. Its cards, labels, status panels, gauge, icons, and footer groups can be restyled, renamed, connected to firmware values, or reused as the foundation for another clinical, laboratory, industrial, or safety-critical display concept.
The sample screen uses a dark navy background with bright cyan, teal, blue, amber, and red status colors. Large white numeric values carry the primary information, while smaller labels and captions provide units and context. This creates a useful reference for designing an information-dense LVGL dashboard without making every element compete for attention.
This is a visual UI template and engineering prototype, not a certified medical device, diagnostic tool, treatment system, or validated clinical alarm. The sample values and timing states are illustrative. Any real medical product requires qualified clinical input, a documented risk-management process, verified software and hardware, usability engineering, alarm validation, cybersecurity review, and compliance with all applicable regulations and standards.
What's included
- One 1024 x 600 LVGL screen, designed for a wide embedded display.
- Clinical header, with the device name, transport ventilation subtitle, system time, battery level, alarm status, and a
CPR MANUALmode badge. - Three ventilation measurement cards, displaying tidal volume, respiratory rate, and minute volume with their units.
- Large airway-pressure panel, using a 320 x 320 arc as the visual focal point.
- Pressure value and unit, shown as
40 mmHgin the sample state. - Pressure scale and target band, including
0,70, and aTARGET 35 - 45 mmHgbadge. - CPR status card, with a heart-pulse icon,
CPR ACTIVEstate,00:12timer, and compression-cycle caption. - Ventilation status card, with a lungs icon,
VENTILATION DUEstate,00:03timer, and manual-breath interval caption. - Oxygen status card, with an airflow icon and
100%sample value. - Clinical status footer, showing the pressure limit, ventilation mode, and patient-circuit readiness.
- Five imported icon assets, covering alarm, battery, heart pulse, lungs, and airflow concepts.
- Five converted Roboto font assets, sized for captions, labels, timers, and large measurements.
All values in the template are placeholders. They are useful for judging hierarchy and spacing, but they are not connected to sensors, validated calculations, treatment timing, or alarm logic.
Dashboard layout
The screen is divided into three reading zones plus a full-width header and footer.
On the left, three equal cards keep related respiratory measurements aligned in a predictable vertical stack. TIDAL VOLUME / mL uses the sample value 586, RESP. RATE / min uses 25, and MINUTE VOL. / L/min uses 14.6. Their labels use different accent colors while the large values keep the same white treatment, making the numbers easy to compare without losing the identity of each measurement.
The center is reserved for airway pressure. A large cyan arc sits on a muted track, with AIRWAY PRESSURE, 40, and mmHg centered inside it. Minimum and maximum scale labels sit near the bottom of the arc, while the green target badge communicates the desired sample range without obscuring the measurement. This central placement makes pressure the dominant live value in the composition.
The right column uses three color-coded status cards. Red identifies the active CPR cycle, teal identifies the next ventilation prompt, and blue identifies oxygen flow. The cards combine a familiar icon, an uppercase state label, a large value or timer, and a short explanatory caption. That repeated structure makes the status column easy to learn while leaving room for different urgency levels.
The footer provides persistent operating context. Pressure limit, ventilation mode, and patient-circuit state remain visible even when attention is drawn to a timer or measurement above. The header performs the same role for device identity, time, power, alarm readiness, and mode.
Asset snapshot
The PicoPixel local library contains a small, focused set of assets:
- Images:
0. - Animated images:
0. - Icons:
5— Alarm Bell, Battery Full, Heart Pulse, Lungs, and Air Flow. - Colors:
0, with the current palette applied directly to objects. - Fonts:
5, all prepared for the dashboard's Roboto typography hierarchy. - Components:
0.
The icon files are compact PNG assets at their intended UI sizes:
26 x 26Alarm Bell.28 x 28Battery Full.40 x 40Heart Pulse.44 x 44Lungs.38 x 38Air Flow.
The included font assets are Medical Roboto Medium 14, Medical Roboto Medium 18, Medical Roboto Bold 24, Medical Roboto Bold 36, and Medical Roboto Bold 54. This range supports small captions, normal status text, prominent timers, and the largest measurement values without importing unnecessary font sizes.
Layer structure
The project contains one screen and 51 named design objects. The main screen is organized into nine top-level groups:
Clinical HeaderTidal Volume CardRespiratory Rate CardMinute Volume CardAirway Pressure PanelCPR Status CardVentilation Status CardOxygen Status CardClinical Status Footer
The project file uses 13 frames for the screen, panels, cards, badges, header, and footer, plus 38 rectangle-backed LVGL objects for labels, values, icons, and the pressure arc. Important objects already have descriptive names such as Airway Pressure Value, Pressure Target Badge, CPR Timer, Ventilation Timer, Patient Circuit Value, and Battery Level.
That naming makes the template easier to inspect and extend than a generic hierarchy of numbered objects. Before export, you can still adapt the names to your firmware conventions, for example airway_pressure_arc, airway_pressure_value, tidal_volume_value, respiratory_rate_value, cpr_timer_label, and patient_circuit_status.
Visual system and information hierarchy
The template demonstrates several patterns that transfer well to embedded monitoring interfaces:
- Large numerals for changing values, so the most important data can be read quickly.
- Units placed close to values, reducing ambiguity when several measurements share the same screen.
- Consistent card geometry, which makes related measurements feel like one system.
- Color used as reinforcement, while words and icons still communicate what each status means.
- Reserved alarm colors, with red and amber used selectively instead of decorating every panel.
- Persistent mode and readiness states, kept in the header and footer rather than mixed into the central measurement area.
- Generous dark negative space, separating dense information without relying on heavy borders.
- A single dominant gauge, preventing the dashboard from becoming a wall of equally weighted charts.
For a real product, do not rely on color alone. Preserve readable labels, test contrast on the target display, account for color-vision differences, and define how warning, caution, normal, unavailable, stale, disconnected, and fault states differ in both appearance and behavior.
Why this works well for LVGL
The dashboard is made from objects that map naturally to an LVGL application.
- The pressure gauge uses an arc-style object, so firmware can update its value without rendering a new bitmap.
- Measurements and timers are labels, which can be updated with normal LVGL label APIs.
- Cards and badges are containers, making it straightforward to change borders, backgrounds, visibility, and state colors.
- Icons are small assets, avoiding the memory cost of storing the entire screen as an image.
- The wide layout is explicit, giving you a clean 1024 x 600 baseline for a known panel resolution.
- Groups have meaningful names, making exported object references easier to identify in application code.
- The visual design is decoupled from device logic, so data acquisition and validated control behavior can remain in dedicated firmware modules.
The supplied project is a static presentation template: it does not include configured events, animations, sensor connections, alarm evaluation, or CPR timing logic. Those behaviors must be designed and verified separately for the intended device.
Connecting live data
After exporting the UI, update the visible values from a well-defined presentation layer. Keep raw sensor acquisition, filtering, limits, alarm decisions, therapy control, and safety checks outside generated UI code. The UI should receive already validated display values and explicit state changes.
A simplified LVGL presentation function could follow this pattern:
static void monitor_ui_set_values(int airway_pressure_mmhg,
                                  int tidal_volume_ml,
                                  int respiratory_rate,
                                  float minute_volume_l_min)
{
    lv_arc_set_value(ui_airway_pressure_arc, airway_pressure_mmhg);
    lv_label_set_text_fmt(ui_airway_pressure_value, "%d", airway_pressure_mmhg);
    lv_label_set_text_fmt(ui_tidal_volume_value, "%d", tidal_volume_ml);
    lv_label_set_text_fmt(ui_respiratory_rate_value, "%d", respiratory_rate);
    lv_label_set_text_fmt(ui_minute_volume_value, "%.1f", minute_volume_l_min);
}
This example only demonstrates UI updates. It is not a safe or complete medical-device architecture. A production implementation needs defined data validity, unit handling, bounds, stale-data behavior, fault states, timing guarantees, logging, and verified alarm priorities.
Customizing the template
Use the dashboard as a visual starting point, then adapt it to the exact purpose and constraints of your project.
- Replace the sample title and subtitle with your device or prototype name.
- Change the 1024 x 600 screen size to match your target panel, then rebalance the three dashboard columns.
- Replace sample measurements with the values your device actually needs to show.
- Adjust the pressure range, arc value, units, and target badge for your intended non-clinical demo or validated specification.
- Create explicit unavailable and sensor-disconnected states instead of leaving an old value on screen.
- Add trends, waveforms, or history only when they improve a clearly defined operator task.
- Turn the mode badge into a real mode selector only after defining safe transitions and confirmation behavior.
- Add screen navigation for setup, logs, maintenance, or help without hiding critical current-state information.
- Convert repeated cards into reusable components if you plan to create several related monitoring screens.
- Replace the icon assets or fonts to match your product system and memory budget.
Because the template has no built-in events, you can add only the interactions your product needs instead of removing demo wiring first.
Exporting to your project
Open the project in PicoPixel, inspect the named layers, replace the sample content, and preview the result at the target resolution. Then export the UI as LVGL C code and integrate it with your display and application layers.
A typical prototype workflow is:
- Open the template in PicoPixel or download the
.picopixelfile locally. - Confirm the display resolution, color depth, orientation, and memory limits of the target hardware.
- Rename any remaining objects to match your firmware naming convention.
- Replace sample values, units, states, limits, and captions with approved product requirements.
- Add only the required navigation and interaction events.
- Export the PicoPixel project as LVGL C.
- Add the generated UI and assets to your ESP-IDF, Arduino, PlatformIO, STM32, Zephyr, or other LVGL application.
- Connect the labels, arc, badges, and status panels to a validated presentation interface.
- Verify the complete behavior on the real display across normal, warning, error, unavailable, and recovery states.
For the import workflow, read How to use PicoPixel templates. For a broader embedded integration walkthrough, see the ESP32 LVGL UI tutorial.
Safety and production note
Medical and other safety-critical interfaces cannot be validated from a screenshot or visual editor preview alone. If you adapt this design for a real device, involve qualified domain experts and define objective acceptance criteria for legibility, alarm behavior, control safeguards, timing, data freshness, failure handling, and operator response.
The final system may need to address standards and regulatory requirements that depend on its intended use, market, risk classification, hardware, software architecture, and clinical claims. Treat this template as a design accelerator for exploration and prototyping—not as evidence of safety, effectiveness, certification, or regulatory compliance.
Best uses
This template is a strong starting point for:
- LVGL medical dashboard concepts
- CPR assist UI prototypes
- Transport ventilation display mockups
- ESP32 and STM32 wide-screen interface demos
- Clinical-device usability studies
- Laboratory and training simulators
- Safety-critical information hierarchy exploration
- Alarm and status color-system experiments
- Wide industrial monitoring dashboards
- Learning how a dense 1024 x 600 interface can be structured from editable LVGL objects
It is especially useful when you need a polished visual reference with realistic information density, but want to keep the actual device logic, safety controls, and data pipeline separate from the screen design.